


Project Overview
In this project, I analyzed a survey dataset from around 700 professionals to explore various aspects of their work life. The dataset provided valuable insights into professionals' job titles, career transitions, salaries, industries, programming preferences, job satisfaction, work-life balance, and more.
Data Processing and Cleaning:
I ensured data consistency and accuracy by conducting thorough data validation and standardization.
I cleaned the data to prepare it for in-depth analysis.
Key Insights:
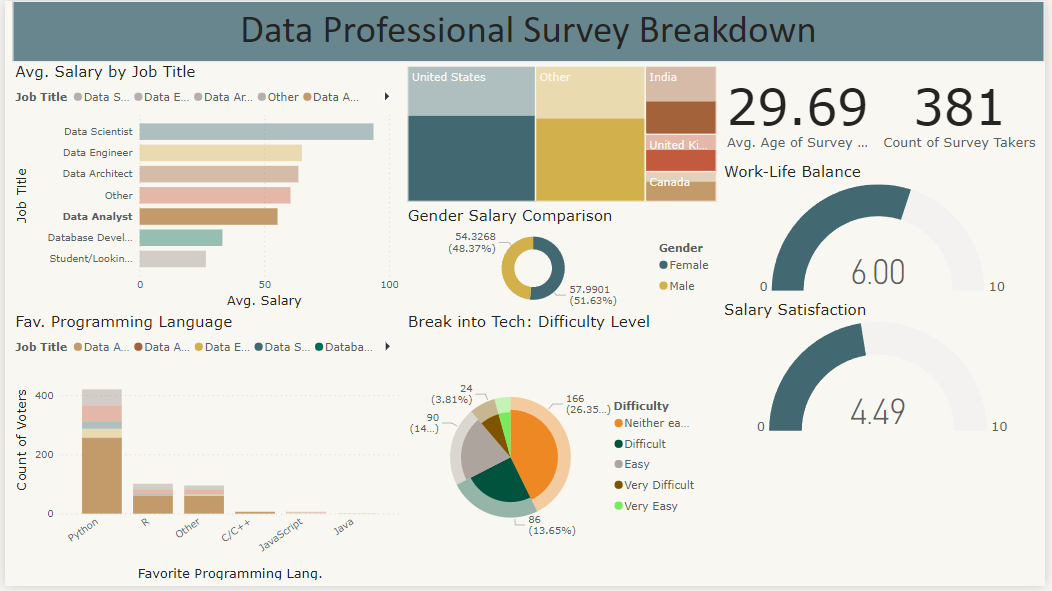
Salary Range: I analyzed salary trends across different factors such as job titles, gender, age, and country to identify compensation patterns in the professional world.
Programming Languages: I assessed the popularity of different programming languages to understand industry trends and preferences.
Salary Satisfaction: I evaluated professionals' satisfaction levels with their salaries based on various factors.
Breaking into Tech: I explored the perceived difficulty of breaking into the tech industry from the perspectives of the survey respondents.
Work-Life Balance: I analyzed professionals' perspectives on work-life balance and its importance in their professional lives.
Visualizations:
I developed six visualizations, including stack-bar charts, pie charts, and heatmaps, to represent the key findings in a clear and compelling manner.
Using DAX and conditional formatting, I created calculated columns to customize the data for specific visualizations.
Conclusion
Through this project, I gained valuable insights into the work life of professionals, highlighting trends and challenges in the professional world. The visualizations I created effectively communicated the findings, offering a comprehensive view of professional perspectives.
This concise overview highlights your role in the project and your approach to data analysis, visualization, and insights. It emphasizes your skills and expertise in presenting findings in a clear and impactful manner.
Data Professional Survey Analysis - Power BI