


Project Overview
This Power BI project involved the analysis of a dataset consisting of 1000 individual claims. The primary focus of the project was to explore insurance data and claim incidents, providing insights into the characteristics of the claims, the insured individuals, and the incidents themselves. The data was organized into four main categories: the insured person, policy details, incident description, and vehicle characteristics.
Dataset Details:
The dataset contained 40 different attributes for each claim, including:
Duration of customer relationship (months_as_customer)
Insured person's demographics (e.g., age, insured_sex, insured_education_level, insured_occupation)
Policy information (e.g., policy_number, policy_bind_date, policy_state, policy_csl, policy_annual_premium)
Incident details (e.g., incident_date, incident_type, collision_type, incident_severity, incident_location)
Claim characteristics (e.g., total_claim_amount, injury_claim, property_claim, vehicle_claim)
Vehicle details (e.g., auto_make, auto_model, auto_year)
Fraud indicator (fraud_reported)
Project Goals:
The key objectives of the project were:
Fraud Analysis: Analyzing the distribution and patterns of fraudulent claims to identify potential fraud risks.
Attribute Relationships: Exploring the relationships between different attributes and the likelihood of fraud.
Insights into Claims: Understanding claim characteristics and identifying trends in claim amounts and distribution.
Incident Analysis: Examining trends in the time and location of incidents.
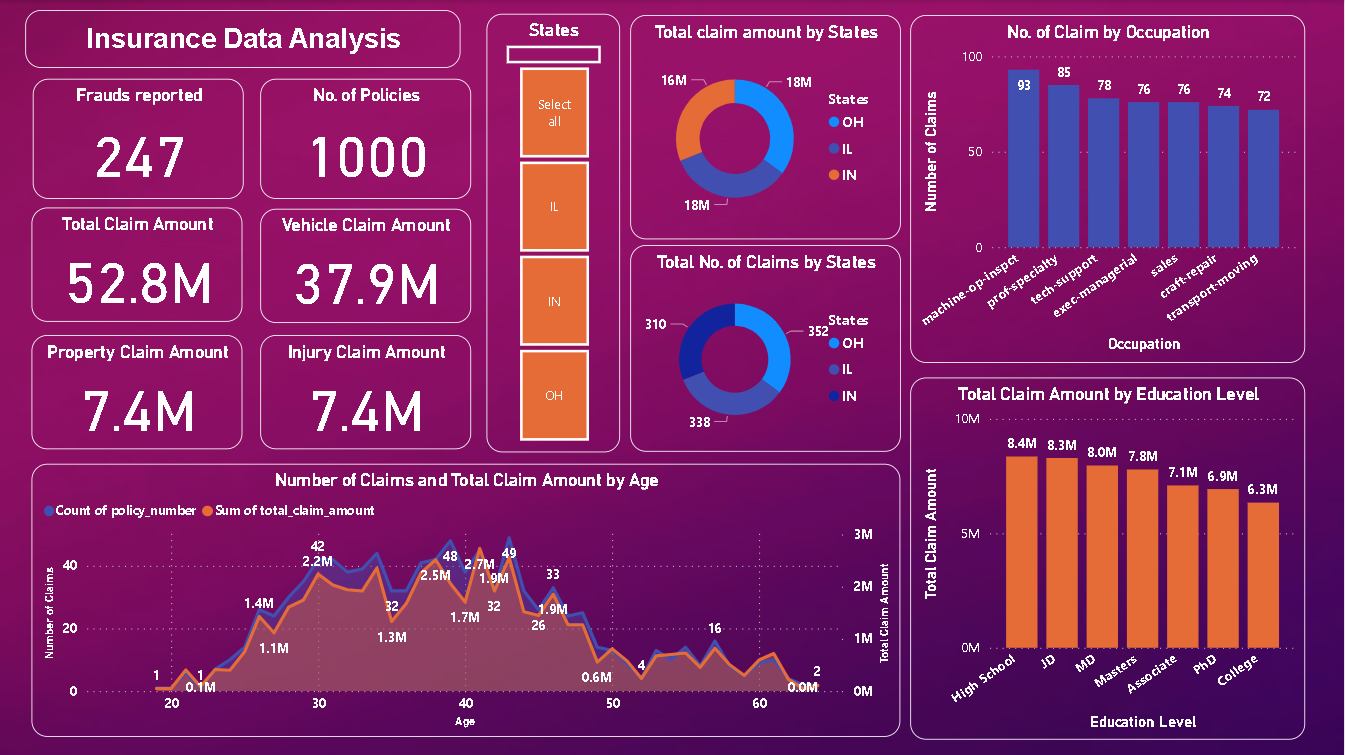
Data Analysis & Visualizations:
Power BI was used to create interactive visualizations and dashboards for the data analysis. Key visualizations included:
Bar Charts: To show the distribution of claims and claim amounts across different occupations and education levels.
Pie Charts: To display the breakdown of claims and claim amounts.
Line Charts: To explore the relationship between the age of the insured person and the number of claims.
Time Series Charts: To analyze incident frequency and trends over time.
Gauges: To present claim amounts and distribution across various categories.
Conclusion:
This project provided valuable insights into insurance claim data and claim incidents, with a focus on detecting and understanding potential fraud. By visualizing patterns and trends in the data, the project aimed to support insurance professionals in improving claim management processes and identifying potential fraudulent claims.